Declaration:
This is my own work and represents my learning in this assessment. Any information sourced from elsewhere has been appropriately acknowledged and referenced. I have and will continue to maintain the privacy of any person I have referred to in this assessment and have sought their permission to have their information shared here. I acknowledge a copy of my work may be used for moderation purposes. I have a back up copy of the work I have presented in this assessment if it is required.
Signed: Vladimir Borzenko
References:
Automotive Mechanics 8-th Edition , Ed May and Les Simpson.2010
7A-FE engine manual, Jul.2000 production
4A-FE engine manual, 7A-FE engine manual supplemental, Jul.2000
http://www.howstuffworks.com/engine.htm
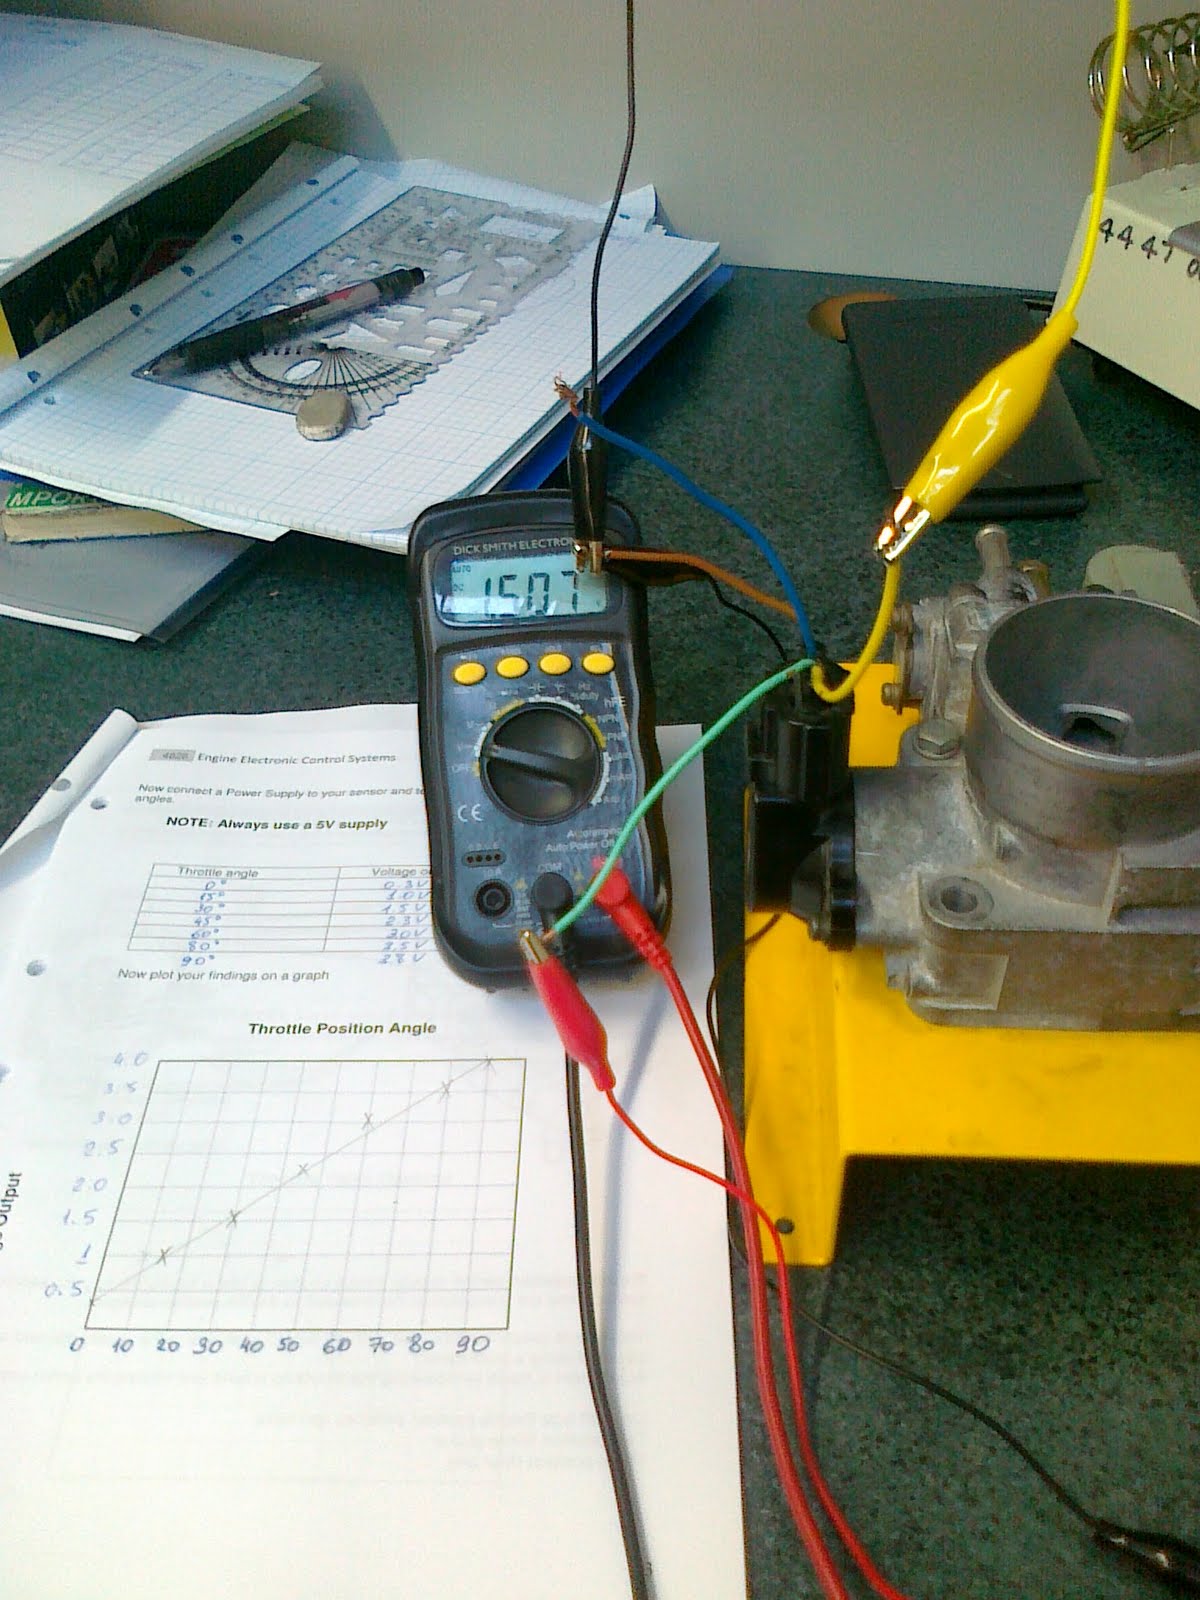
There are two variants whether throttle position sensor or throttle position switch. Regardless to the type TPS supply the ECU with the information about throttle status and Driver's demand. As we will see several experiments later the quality of this information is far different. Any way, this information is used by ECU to process it and send the command to the actuators.
There is a diagram of Linear Type TPS.

The linear TPS is mounted on the throttle body. It is consists of two movable contacts, a fixed resistor and four electrical terminals. This two contacts move along the same axis as the throttle valve. One is used for the throttle opening signal (VTA) and other for closed throttle signal (IDL). As the throttle moves, a potentiometer provides the ECU with variable voltage signal. This signal is proportional to the throttle angle. Graph below illustrates this picture very accurately.
The IDL contact is closed when the throttle is closed. At the moment when throttle opens the IDL contacts break. This cause signal to go from low to high and gives this information to the ECU.
Vcc-voltage constant control (5 V reference)VTA- voltage throttle angle
IDL-idle switch
E2-earth (sensor return path)


 The mounting holes allow adjusting initial TPS position by measuring VTA and changing the TPS angle
 Procedure rule according t the TOYOTA manual:
a) Insert a 0.7 mm thickness gauge between the throttle stop screw and stop lever
b) Connect the test probe of an ohmmeter to the terminals IDL and E2 of the sensor.
c) Graddually turn sensor clockwise untill the ohmmeter deflects, and secure it with the two set screws.
Throttle Position switch.
Throttle Position Switch was mainly used in earlier generation of EFI systems. Basically it allowes the ECU only fuel cutt-off and ignition timing correction.


PSW- power switch
IDL- idle
E-earth
Ohmmeter reading is plotted on the graph:


N.B. To read this graph easier I have re-drawn it with enother schematic design:

Conclusions: with evolution from position switch to the throttle position sensor the ECU monitores the engine mode more precisely and continuously.
MAP sensor ( Manifold Asolut Pressure sensor)


MAP sensor reads a negative pressure.In fact, as manifold pressure getting closer to the atmosphere pressure the PIM voltage increases.
There are a piezoresistive chip, IC(integrated circuit) and "perfect vacuum" chamber inbuilt into the MAP body. Both, "perfect vacuum" and current manifold pressure applied to the silicon chip. With changes in manifold pressure the silicon chip flexes. As a result, its resistance changes and causes PIM voltage. This voltage gives the information to the ECU about engine load.
MAF (AIR FLOW/MASS SENSOR)

In practice we should have seen voltage reading around 1 Volt at the beginning of the experiment. And, if the air flow increases the voltage reading goes up to the 4.5 Volts. However it turned out that our MAF sensor was faulty (wire was cracked).
Graph below illustrates what kind of reading I expected to see. The voltage rises unevenly due to air flow inertia.


Vane Type Air Flow Meter
The AFM provides the ECU with the most important information about engine load. This device measures air volume. It incorporates measuring plate, compensation plate, return spring, potentiometer, and by-pass passage. The adjusting screw is preset by manufacturer and allows Idle Mixture being adjust.


The measuring voltage reading with relation to vane angle lays within the spec. I 've drawn two graphs in different variants because for some reason manufacturers illustrate them in both manners. The easiest way will be to use the one in the same manner as the manufacturer. Voltage reading must be between 0.5 volts and 5.5 volts.
The internal operation of AFM can be described as following:
The internal operation of AFM can be described as following: when air passes through the AFM it counteracts to the return spring and preloaded spring opens. The potentiometer connected to the plate converts mechanical motions into the voltage signal which varies depending on the angle of the plate
Coolant Temperature Sensor


This device functions as following:
THW is wired into the ECU circuit as voltage devider resistor. That's why the higher temperature the lower resistance but voltage is lower as well.
Thermo Fan Switch.
This switch controls fan relay. When temperature is below 90 degrees thermo switch is closed. As a result, relay winding circuit is energised and fan circuit is opened. Once temperature reaches 90 degrees thermo switch opens and de-energise the relay. Since this moment fan starts to rotate. All this action of thermo fan switch bases on its properties. Metal wire with specific thermal-conductivity coefficient bents under curtain temperature. In this case it must be 90 degrees Celsius. However, switch was conducting until 93-94 degrees Celsius. This could happen due to components tolerance. Once water temperature reached this point the multimeter showed infinite resistance.


 The graph and photos illustrate the experiment.
AIR TEMPERATURE SENSOR


This graph reflects that sensor characteristics slightly differ from the manufacturer ones. According to the TOYOTA MOTOR CORP. spec at the temperature 40 degrees Celsius sensor resistance must be 1 KOhm.
However, this graph confirms that ATS has negative temperature coefficient. This means that relation between resistance and temperature is in inverse proportion.
Knock Sensor
This sensor is a device which is bolted into the engine block and can “register” detonation. Such a specific properties as piezoelectric effect allows it producing voltage when it flexes. When detonation occurs it influences onto the sensor and voltage from this sensor is filtered by the active filter built on the op-amp. Frequency of sonic noise is separated from background sounds by filter and is sent as a signal to the ECU. The ECU reacts instantly either changing time of Injectors opened or retarding the ignition.
Knock Sensor is wired into the circuit as follows:


Once this sensor was knocked by metallic stick during the experiment the oscilloscope registered voltage on the signal wire. The image below illustrate the output signal:

OXYGEN SENSOR
The experiment with oxygen sensor was held as follows:
Sensor was clamped in the vice-grip. Propane was used to hit up the sensor. The oscilloscope connected to output has shown almost instant reaction. Voltage around 0.8v occurred in several seconds. Once the sensor was removed from flame, voltage dropped almost to 0v. This means that the oxygen sensor is in a working condition.
The pattern registered with oscilloscope is on the image:

As it seen from the pattern OXYsensor signal cycles between high and low voltage.
ELECTRONIC INDUCTIVE DISTRIBUTOR
The pattern registered by oscilloscope reflects the process of how the inductive type distributor operates.


During the period, which is marked with blue line between B and C points, the magnetic field induces. Once the reluctor is about to move away from pickup winding the magnetic field reaches maximum or peak (winding is saturated), which is point A on the pattern. This is near TDC. Once magnetic field starts decreasing voltage goes down and back EMF takes place. Point B illustrates the moment when cylinder reaches BDC. Unfortunately, the condition of distributor and the experiment is not ideal. That’s why shape of pattern is not such a clear. But any way, it illustrates the principle of inductive type distributor operation.
This principle is actually based on the alternator theory. The shape of the waveform is close to the sinusoidal one. In practice shape of teethes influences on the waveform. The Majority of pickups produce a signal of 3 v from pick to pick.( at IDLE). The amplitude of the signal depends on the speed in direct propotion.
A distance between pickup coil and relactor is essential because it is related with wave strength. This clearance is always specified by manufacturer and can be measured with brass feeler gauge only. Brass helps to avoid sparks. It has low rate of conductivity.
Adjusting Air Gap on Magnetic Distributor
As shown in the table both coil air gaps are within specification. All these measurements were done before the signal reading experiment conducted.
The inductive distributor is vusually in a working condition. Test of the trigger coil for serviceability is in the table. Either G also NE pickup coil are within spec.


 This distributor produces almost square pulses with constant amplitude. When chopper plate passes gate between magnet and hall-effect chip the magnetic field collapses. Due to hall-effect voltage occurs at the edges of the chip at 90 degrees to the current track. That voltage comes to the inverting input of op-amp. This op-amp in its turn switches on power transistor. As a result voltage is grounded at the moment and digital signal is produced.


 The on-board connection were pretty simple and was done without any difficalties.
However, it's important to bear in mind that all the calculation must be done on the basis of datasheet for both transistor and ignition coil. That's why coil was tested before the calculation.
To sum up, all the experiments on the ignition systems underlined that electronic module is more precise, less complicated and much more reliable as triggering device for the ignition system. The triggering device always complites circuit by grounding primary path for the magnetic field being built up. To collaps magnetic field and get a spark, trigger disconnects primary circuit from the ground. This principle works regardless to the type of the ignition system.
This principle is actually based on the alternator theory. The shape of the waveform is close to the sinusoidal one. In practice shape of teethes influences on the waveform. The Majority of pickups produce a signal of 3 v from pick to pick.( at IDLE). The amplitude of the signal depends on the speed in direct propotion.
A distance between pickup coil and relactor is essential because it is related with wave strength. This clearance is always specified by manufacturer and can be measured with brass feeler gauge only. Brass helps to avoid sparks. It has low rate of conductivity.
Adjusting Air Gap on Magnetic Distributor
As shown in the table both coil air gaps are within specification. All these measurements were done before the signal reading experiment conducted.
The inductive distributor is vusually in a working condition. Test of the trigger coil for serviceability is in the table. Either G also NE pickup coil are within spec.


N.B. brass feeler gauge only
Hall-effect Distributor


The pattern image above shows what we should have on our oscilloscope screen. However, due to either poor grounding inside of distributor or faulty hall-effect chip, the experiment was partially failed.

As it follows from schematic diagram, the impotent issue of this device is that dwell period is actually the top of the pulse. The shape of the tab provides this fixed dwell period. The window provides fixing firing period. From the image I’ve taken we can see that picture reflects digital properties of this sort of signal.


From A to B is signal amplitude. From A to C is dwell period. From C to D is firing period. So, the signal out is “on” and “of”.
Optical Distributer
This distributor produces a digital signal to trigger the primary coil. Triggering occurs by earthing power transistor. Once relactor passes against the LED the photo-diode it’s off. No grounding at the moment and the signal out is high. Once the photo-diode is on it pulls the signal down to earth. The magnet field i the primary coil collapses, ignition occurs and this is firing time.
So far, the shape of relactor teeth provides firing time and tells the ECU numbers of cylinders. The shape of the windows provides dwell period.

Below are schematic diagram, wiring diagram and patterns of the optical distributor in theory.

On the photo below there is a pattern I got as a result of experiment. The reason of so poor quality outcome was bad earth. However, our “of” signal occurs when voltage is high, “on” signal when voltage is low. At the moment when voltage goes down firing occurs. The conclusion of bed earth was made on the basis of such a specific shape of the bottom part of the pulse.

All experiments on the distributors revield and proved that inductive type distributer produses analog signal and both optical and hall-effect distributors produce digitals signals. That is why the last two are much more in use laterly. Less number of operation, fewer number of devices increases relayabilty and simplify constructions.
Injector Testing
Table of Injectors’ Resistance


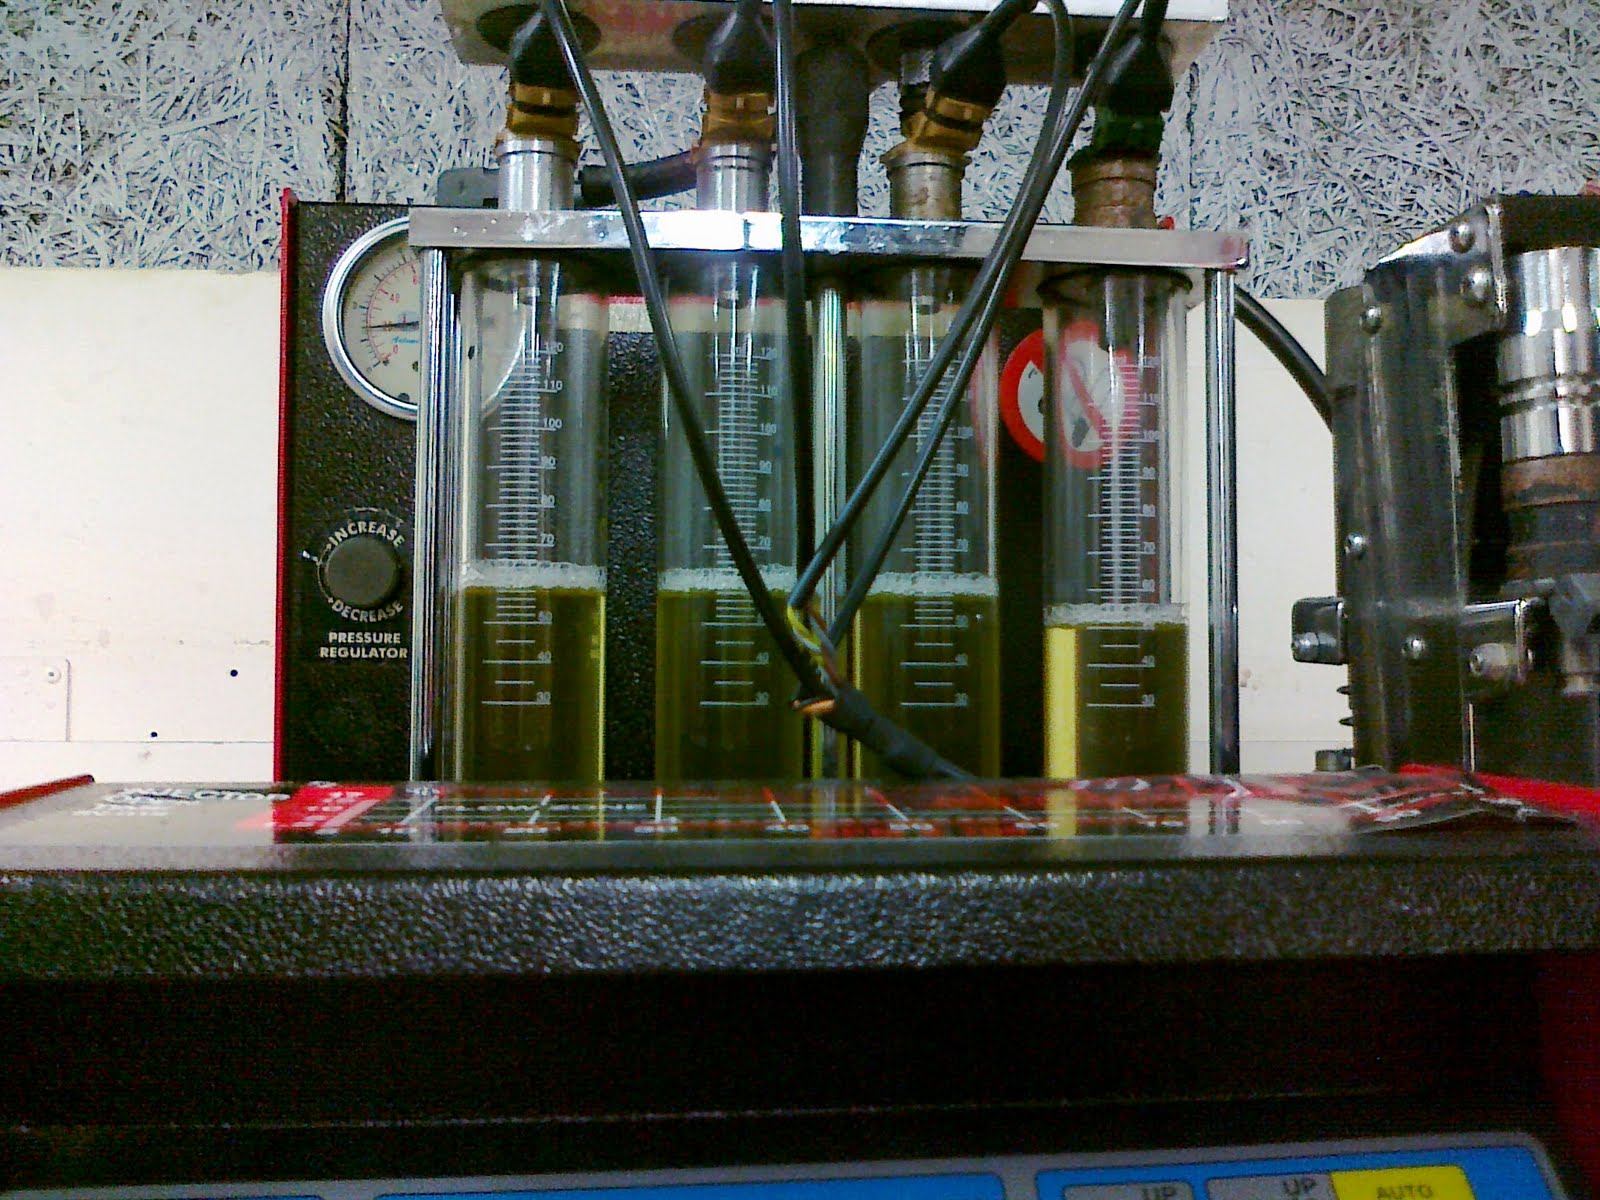


The injectors 1,2,3 flow rate is 45 cm(3)/15sec. The injector #4 has 37.5 cm(3)/15sec. The spec of DENSO injectors lays in frame between 40 and 52 cm(3) per 15 sec. Thus, the injector#4 is out of spec. Visual inspection of sprayed pattern revealed that 1,2,3 injectors produced good even cone spray patterns. But injector #4produced offset pattern. Leakage test didn’t reveal any faulty signs. To sum up, the only faulty injector #4 must be replaced.
TESTING IGNITION COILS
Image1. Testing Primary Coil

Image2.Testing Secondary Coil


Specification Coil Test Results
Coil#1 CGR-500
Voltage 12 V
Primary 3-4 Ohms 1.8 Ohms (out of spec)
Secondary 7-8 KOhms 7.92 KOhms

Specification Coil Test Results
Coil#2 Bosch SU12
Voltage 12 V
Primary 3-4 Ohms 2.2 Ohms (out of spec)
Secondary 8-9 KOhms 9.2 KOhms (out of spec)
The two coils above are out of specification and are not serviceable.
Wasted Spark Coil Pack
The first coil pack has in-built igniter, so that the only possible measurements are:
Coil#1 Secondary 5.76 KOhms; Coil#2 Secondary 5.9 Kohms.


The second coil pack has no in-built ignition module, so that measurements are:
Coil#1 Primary 0.9 Ohms Secondary 7.13 Kohms
Coil#2 Primary 1.0 Ohm Secondary 7.11 Kohms
Such kind of figures demonstrate that number of windings in the secondary coil is much greater compared to the one in the primary coil. This the main principle on which step-up transformer is built.
Testing Ballast Resister
Specification for ballast resister #1 BR3 is 1.6 Ohms but measurement is 3.6 Ohms

Specification for ballast resistor #2 BR1 is 1 Ohm but measurement is 3.5 Ohms

Thus, both resistors are out of specification.
Measuring Current Draw and Voltage Drop


Wiring up Ignition System using a function generator, trigger module and standard coil.


WIRING UP IGNITION SYSTEM WITH A DISTRIBITOR TO TRIGGER THE IGNITION MODULE


WIRING UP THE WASTED SPARK IGNITION SYSTEM


WIRING UP THE COIL OVER IGNITION SYSTEM


BUILDING A SIMPLIFIED IGNITION MODULE


However, it's important to bear in mind that all the calculation must be done on the basis of datasheet for both transistor and ignition coil. That's why coil was tested before the calculation.
To sum up, all the experiments on the ignition systems underlined that electronic module is more precise, less complicated and much more reliable as triggering device for the ignition system. The triggering device always complites circuit by grounding primary path for the magnetic field being built up. To collaps magnetic field and get a spark, trigger disconnects primary circuit from the ground. This principle works regardless to the type of the ignition system.