The MAP sensor pattern shows voltage depending on “vacuum” rises and drops. It is obvious from the pattern we have that at the point ”A” negative pressure is low so voltage is high. As the throttle is closed, the negative pressure rises, and voltage declines up to the point “B”. With fully opened throttle signal reaches its peak. Signal is not such a smooth due to air pulses.

Unfortunately, the engine ECU we worked with was not genuine unit. The signal amplitude is not correct, but the form of the signal is quite close to the theory. For calculations below I use the standard voltage supply and voltage out.
Vout=(V1-V2)*Rf/Rin
For instance: R1=5KOHMS; R2=10 KOHMS; R3=5KOHMS; R4=2 KOHMS; R5=10 KOHMS; Rf=10 KOHMS; Rin=2 KOHMS
Vout=(V1-V2)*Rf/Rin
V1=(Vcc/(R1+R2+R5))*(R2+R5).
V2=(Vcc/(R3+R4))*R4
In these formulas above R5 is neither more nor less than bad earth.
Once the situation with bad earth occurs, the less voltage out will bring problems with air fuel mixture. It’s going to be lean while the engine is under load. Loss of power will be a symptom in this case.


As shown in calculation Vout will be 1.6 V less ( ^V) compared to the normal signal.

Red line on the graph above demonstrates that voltage out will be one third less compared to normal one. This change in signal is quite noticeable. Good example how pattern analysis helps to identify fault in the circuit.
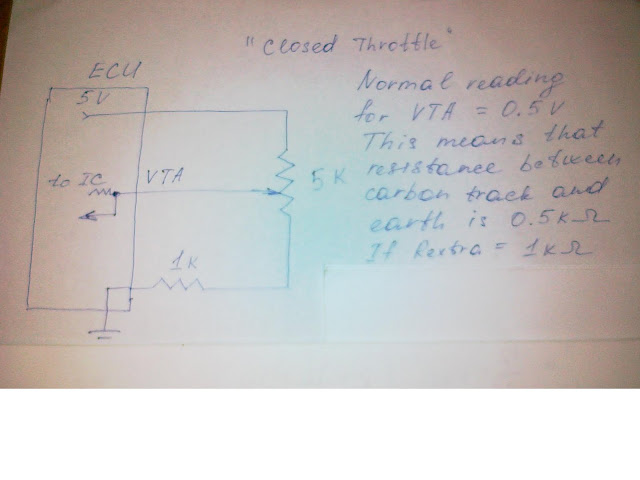
TPS (LINEAR THROTTLE POSITION SENSOR)
This type TPS demonstrates that Voltage out is directly proportional to the throttle position angle. Carbon track potentiometer is part of the voltage divider wiring diagram. VTA signal depends on the position of a sliding wiper.
At the point “A” TPS is closed, VTA is around 0.5 V. With the throttle opened VTA rises from “A” to “B”. After the acceleration completed and pedal released, throttle goes back and comes to the shut position. This path is from ”B” to “C”, and then voltage does not change until next acceleration. If we check signal amplitude and period we will see that this particular engine is not tuned up properly. It is related with not original ECU module. However, the shape of the signal pattern is accurate and matches with theoretical information of linear TPS.
As it is seen from the pattern signal rises and drops down smoothly and evenly. It means carbon track potentiometer is not warned. If it took place it would be blind spots or hesitations in signal reading. The ECU would get wrong information of TPS angle. As a result, flat spots during acceleration would occur.
Another scenario is bad earth. Assuming that R(earth) brings 1KOhm extra, we can calculate what will be the difference between the two signals, right one and wrong one.


Possible consequences are rich mixture at idle RPM, rough idling, unburned fuel in exhaust.
Engine Coolant Temperature Sensor (ECT or THW).
The CTS is a thermistor with such property as ability to alter its resistance with accordance to the temperature changes. It has negative temperature coefficient (NTC). That means with a temperature rises resistance goes down.


Unfortunately, we came to this experiment at the moment when the engine was relatively warm. Anyway, the trend was slightly visible. Temperature increases and voltage decreases. No sudden changes what means that device is working properly.
To simulate a fault we can create a bad earth connection. Because ECT sensor is wired as a voltage divider we can calculate what will be the difference between normal and abnormal thermistor signal to the ECU.


The calculations above have shown that V out will be 1.67 V instead of 1.67V. It means that the ECU will misunderstand the state of coolant and will provide richer mixture while the engine is warm. The outcome will be higher consumption, rough idling.
INTAKE AIR TEMPERATURE SENSOR (IAT)
The IAT sensor is also NTC thermistor with the same winding to the ECU as ECT.

The IAT sensor is also NTC thermistor with the same winding to the ECU as ECT.


It was easier for IAT sensor to capture the pattern compared to the ECT sensor. The heating gun was used for this experiment. The ECU can calculate the amount of air coming into the induction system of the engine. This is because the density of air directly related with its temperature. Therefore, the ECU adjusts the amount of fuel injected into the combustion chamber. Poor ground, high resistance, loos connection in the IAT circuit will lead to the hard cool engine start, richer mixture, and poor fuel economy. The calculation of simulated fault can be done the same way as it was for the ECT sensor.

Vic = Vcc*R2/(R1+R2). From this equasion we can conclude that the extra resistance in addition to the R2 or, for instance bad earth, will lead to the higher voltage going to the ECU. With NTC IAT must send low voltage signal. With bad earth it will be higher voltage. The concequences will be rich mixture, less economical efficiency, higher emission.
IDLE CONTROL ACTUATOR
As it is seen from the patterns below, two signals were registered. They are opposing each other. This sort of counteracting allows controlling ISCV solenoid at a curtain point. As a construction this ISCV has three wires electrical connection. The two signal ideally should have been switched "on" and "off" with a difference in phase of 180 degrees. One at the top which is “A” opposes the one at the bottom which is ”B”. However, keeping in mind that our engine is equipped with aftermarket ECU, we can underline that valve is not working properly but principle can be seen from the patterns. This valve must be switched on and off allowing the predetermined amount of air bypass the throttle. This is how idle speed is controlled in modern cars. Although, valves can be controlled by signal in one direction and in other direction spring can be employed. But that kind of schematic is a bit old and mostly not used anymore.


CRANK SENSOR
Crank angle sensor provides the ECU with information of both speed and position of the crankshaft. Without this information engine won’t run. On the basis of the information the ECU receives it calculates and manages the ignition timing. As the pattern below shows the crank sensor of 1ZZ-FE engine is an inductive type. However, it is not necessary and it can be hall-effect in the modern engine.


Anyway, back to our case, the inductive type sensor acts the same way as AC generator producing alternating current signal. From “A” to “B” the relactor coming closer to the magnetic pickup and induces voltage into the winding. “B’ is a pick of the signal. Starting going out of pickup it evokes back EMF which acts in the opposite direction. That is Part “C”. Then the process repeats . Numbers of revolutions can be calculated from the frequency of crank-angle sensor as well as crankshaft position. This information is used by the ECU for ignition timing.
CAMSHAFT SENSOR
CAMSHAFT SENSOR
This sensor is used to determine speed and position of camshaft. This information allows the ECU to provide a signal for the ignition system and also influence on the fuel delivery. Peak to peak voltage varies with relation to speed. The higher speed the higher voltage. These types of pickups induce voltage on the same principle as AC generators and don't need to be feed with supply voltage. That makes it easier to mount and wire into the circuit. Other characteristics of the sine wave are similar to the crank sensor described above.

These two signals, crank and camshaft, are essential for the ignition timing and fuel injectors operating. And, the ECU cotrols them in relation between each other. Also, for such type of engine as 1ZZ-FE, the camshaft sensor signal is used for variable valve timing with intelligence (VVTI) system.
OXYGEN SENSOR
Pattern we captured with marks on it illustrates the process how the oxysensor works.


The signal path up to "A" point is the time when the signal changes from lean to rich. It takes about 100 mS (T1) for Zirconia type provided it works correctly. Voltage range is between 0.1V for the lean state till 0.8 V for the rich state. What is noticeable time to react from lean to rich and backward ( T11=150 mS) allows to justify if the sensor is in normal condition or is out of spec. In our experiment we cannot justify details unfortunately because of aftermarket ECU. However, trend of oxysensor action is obvious. It produces a signal for adjusting air fuel mixture around curtain point which is supposed to be stochiometric proportion.
Ideally for the Zirconia type this voltage is .45V.
INJECTORS.
This engine employs sequential multipoint injection system. Each injector, which is the electromechanical device, built on the basis of solenoid preloaded by the calibrated spring. The injector is triggered by the ECU. As it is grounded it is "on". As it is disconnected from earth it is "off". This time is measured in ms and it takes around 3.5ms for sequential injection system to keep injectors "on “at IDLE. This duration varies depending on the engine mode. For cold engine the ECU keep it opened for longer time. Under load, while engine accelerates, the injectors are held opened the longest period of time. The schematic marks on the pattern below give us the information:

B- the injector is "off", it's disconnected from ground.
C- voltage of this amplitude is induced into the injector
C-D- time for the signal to die out
All these parameters bove allow analysing the injectors functioning


Comparison between all the signal, we got during the experiment, says that injectors function correctly.
IGNITION TIMING


PRYMARY IGNITION WAVEFORM

A-B is DWELL TIME, period in which circuit is completed via igniter to ground.
B-firing time at which igniter is disconnected from ground and magnetic field collapses in a fully saturated primary coil.
B-C- FIRING VOLTAGE, this shows us what does it takes to push the electron trough the high tension leads and spark plug gap to create sparking
D- burning voltage we spend keep sparking to burn fuel mixture.
E- oscillations in the coil. They occur due to mutual influence between primary and secondary coils by means of EMF. It takes time for the magnetic field it creates to die out.
So that, experiment underlined that using oscilloscope we can analyse the process in details. From this we can read a picture of current condition and functioning of each component of the ignition system. Moreover, if use raster and patterns parade, we can compare all the cylinders and by doing this localise the fault. Thus, oscilloscope is the main tool for this purpose, especially because we are looking at milliseconds and tiny fluctuation in the signal readings. MAF SENSOR SIGNAL (LAND ROVER)
If we look at the pattern below we can see a good example how confusing the reading could be. What has actually happened during the experiment? All the pins on the MAF sensor were identified accurately, the oscilloscope was wired properly, but the point where we grounded the negative lead was such a specific. It was a TPS housing with electromotor inside. As a result, mutual influence of two electronic devices and interference onto the negative oscilloscope probe. We repeated the experiment three times till the mistake were found. After the oscilloscope probe was grounded directly to the battery the good reading was captured. This is the pattern at the bottom of the page.

From this pattern we can see that, with acceleration, the air flow rises up to the peak, then due to influx air flow inertia it drops down nearly in a half and returns back to the peak. Once the deceleration takes place, signal decreases. Small oscillation at the low level shows that it takes curtain time for the signal to die out. All in all after all these attempts we got reasonable reading with good understanding that all connections must be double checked before coming to conclusion. In addition, the electronic devices compatibility is very important subject we must be good at. Otherwise, such kind of mistakes will affect the whole work outcome.

Excellent it just goes to show how important it is to get a good connection with your equipment. Can we use these two pictures as an example for other students? If so Email them to me
ReplyDelete